The Cost of Card Payments for Merchants
The average cost for a merchant to accept a card payment has declined over recent years. However, consumers are making more payments with cards than ever before, which is raising total payment costs for merchants. Smaller merchants also face notably higher card payment costs per transaction than larger merchants. To strengthen competition and help reduce the cost of accepting card payments, the Reserve Bank wants all merchants to be able to choose which card network is used to process debit transactions – a functionality known as least-cost routing (LCR). While considerable progress has been made, the payments industry has more work to do to provide and promote LCR. The Bank is taking further action to ensure that LCR will be available for all merchants.
Introduction

Cards are the most frequently used payment method in Australia. Over the past few decades, card payments have grown strongly, driven by changing consumer preferences and increasing acceptance of cards by businesses. The COVID-19 pandemic reinforced this trend, with many businesses discouraging the use of cash due to hygiene concerns, while consumers also used less cash and made an increasing share of their purchases online.
When a merchant accepts a card payment, they are typically charged a ‘merchant service fee’ by their payment service provider for processing the transaction. [1] These fees can differ based on the type of card used in the transaction (e.g. a credit or debit card), the type of transaction (e.g. online or in person) and the card network through which the transaction is processed (e.g. eftpos, Mastercard or Visa). Providers may also charge merchants different rates depending on the merchant’s size and industry.
Merchant service fees are comprised of three elements:
- Interchange fees – wholesale fees set by card networks that are paid from the merchant’s financial institution (acquirer) to the cardholder’s financial institution (issuer) on every transaction. These fees can vary based on factors like the type of card, whether it is an online or in-person transaction, the value of the transaction and the size of the merchant. For example, cards that provide rewards to the cardholder (such as ‘gold’ or ‘platinum’ credit cards) have higher interchange fees.
- Scheme fees – fees payable separately by both acquirers and issuers to card networks for the services they provide (often charged on a per-transaction basis).
- Acquirer margin – additional fees levied on merchants by their acquirer, to cover the acquirer’s cost of providing card acceptance services to merchants.
The Reserve Bank’s Payments System Board has responsibility for promoting the stability, efficiency and competitiveness of Australia’s payments system. Given the prominence of card payments in Australia, the Bank views merchants’ card payment costs as a key indicator of efficiency and competition in the payments ecosystem. In line with its mandate, the Board has introduced a number of reforms since the early 2000s that have helped drive down the average amount merchants pay for each card transaction. The Board announced a range of policy measures aimed at maintaining downward pressure on merchant payment costs in the Bank’s 2019–2021 Review of Retail Payments Regulation (the ‘Review’) (RBA 2021).
This article examines developments in merchant payment costs using a range of data available to the Bank, including new, more detailed data on aggregate merchant service fees. [2] These data show that the costs merchants pay per card transaction have continued to trend down over recent years. Drawing on a database of payment costs for individual merchants, the article shows how the cost of accepting card payments varies not only across different card networks, but also across different merchants. Most notably, smaller businesses tend to face significantly higher average merchant fees than larger businesses. Across all merchants, debit cards remain significantly cheaper for businesses to accept than credit cards. The data also show that merchants are charged materially less for debit transactions that are processed via the eftpos network compared with the Mastercard and Visa networks.
Finally, drawing on a new data collection, the article provides an update on the availability and take-up of least-cost routing (LCR), also known as merchant-choice routing. LCR refers to functionality that allows merchants to choose which card network is used to process debit card transactions – typically the network that costs them the least to accept. The Bank views LCR as a key mechanism for promoting competition and efficiency in the debit card market, and expects payment service providers to offer and promote LCR functionality for ‘device-present’ (or in-person) transactions and, by the end of 2022, for ‘device-not-present’ (or online) transactions. The data show that LCR is currently available to the vast majority of merchants for in-person debit transactions. However, take-up remains relatively low, suggesting that many more merchants could be benefiting from LCR.
Aggregate data on payment costs: Average merchant fees have decreased over time
The Reserve Bank publishes quarterly data on average merchant fees per transaction for the main card networks operating in Australia. [3] Across all networks, there has been a significant decrease in the average merchant fee since the early 2000s. This reflects a shift by consumers away from credit cards towards debit cards, which tend to be less expensive for merchants to accept (Graph 1); debit cards accounted for 58 per cent of the total value of card payments in 2021, up from 42 per cent a decade ago. The decline also reflects lower average merchant fees for most card networks (Graph 2).
Graph 1

Graph 2

Looking at the different card types, the average merchant fee for credit cards has declined over the past 10 years, driven by competitive pressure between credit card networks. This is partly due to Reserve Bank reforms that allowed merchants to surcharge their customers for card payments. This led to a decline in the average fees and market share of the more expensive American Express and Diners Club networks, which pushed down aggregate credit card fees.
By contrast, the average merchant fee for debit cards has generally fluctuated within a narrow range, with downward pressure from the Bank’s reforms to debit interchange fees and competitive pressure from LCR offsetting upward pressure from the increasing market share of the (generally more expensive) Mastercard and Visa debit networks. The Bank lowered the benchmark it sets for average debit card interchange fees in 2017, which contributed to a decline in fees for Mastercard and Visa debit cards. [4] At the same time, however, the rise of contactless transactions, including via mobile wallets (such as Apple Pay and Google Pay), has led to an increase in the market share of the Mastercard and Visa debit networks, because such transactions are typically sent to these networks by default. Mobile wallet transactions have grown strongly in recent years and accounted for around 27 per cent of debit card transactions (by number) in the March quarter of 2022.
The COVID-19 pandemic has affected merchant service fees in a number of ways. Many acquirers offered merchants temporary fee waivers, which drove a fall in fees in mid-2020. Additionally, there was a shift in consumer behaviour, with a marked increase in the use of debit cards rather than credit cards, consistent with households’ increased saving reducing their need for credit. Travel restrictions also drove a fall in transactions on foreign-issued cards in 2020 and 2021. Given that credit cards and foreign-issued cards are relatively expensive for merchants to accept, these developments contributed to a fall in average fees. However, average fees have risen over the past year or so, as the fee waivers ended and international travel began to recover.
The cost of accepting a card payment varies depending on the card network that processes the transaction (Graph 2). These differences depend on the prices set by both acquirers and card networks. As mentioned above, card networks set the interchange fees and scheme fees that apply to the transactions they process, with these costs ultimately passed on to merchants. Acquirers may also impose different margins on transactions of different networks. Payments made through the domestic debit card network, eftpos, are generally the least expensive, costing merchants an average of 0.3 per cent of the transaction value; this cost has been broadly unchanged over the past decade. This compares with average merchant fees of 0.5 per cent for both Mastercard and Visa debit card transactions, which have trended down in response to LCR and the policy measures noted above. The costs of accepting American Express and Diners Club cards have declined significantly over the past decade, but they remain the most expensive networks, with average merchant fees of around 1.3 per cent and 1.7 per cent of the transaction value, respectively. By contrast, Mastercard and Visa credit card transactions attract an average merchant fee of 0.9 per cent.
Merchant fee comparisons across networks are complicated by both compositional differences in the transactions processed by the networks, as well as the way acquirers charge merchants. For example, unlike Mastercard and Visa, eftpos does not process foreign-issued card transactions, which for Mastercard and Visa have significantly higher interchange fees than transactions on domestic cards. Additionally, eftpos has only recently begun processing online transactions, which can also attract different interchange and scheme fees. This means that the difference in the cost of accepting a specific transaction across networks could be quite different to that suggested by the aggregate data (which has implications for the size of potential savings for merchants from LCR). To address these compositional differences and allow for more meaningful comparisons across networks, the Bank recently began collecting and publishing more granular data on merchant fees that distinguishes between network, card and transaction type. The new data allow for comparisons of the cost of accepting domestic and foreign-issued card transactions, and device-present and device-not-present transactions, for both debit and credit cards and for each network individually.
Given the compositional differences noted above, the most meaningful comparison across the debit networks – at least while eftpos’ online volumes remain low – is the cost of domestic device-present debit transactions. For these transactions, eftpos is still generally the least expensive to accept, with an average fee around 0.24 percentage points lower than the other debit networks in the first half of 2022 (Graph 3). The new data also confirm that foreign-issued credit card transactions are significantly more expensive to accept than domestic credit card transactions, by around 1 percentage point on average. Overall, device-not-present transactions are cheaper on average than device-present transactions, due to large merchants that can negotiate lower fees making up a larger share of device-not-present transactions.
Graph 3

While these new data allow for more meaningful comparisons across networks, such comparisons remain complicated by acquirers’ pricing practices. In particular, a sizeable share of merchants are on ‘blended’ pricing plans, where the merchant is typically charged a specified per-transaction fee either for each international card network (e.g. a single rate for all Visa debit and credit transactions) or for multiple networks (e.g. a single rate for all Mastercard and Visa debit and credit transactions). Since the wholesale cost of credit transactions is on average much higher than for debit transactions, these blended rates are higher than those that would apply if debit transactions were priced separately. Accordingly, these plans inflate the average reported cost of accepting Mastercard and Visa debit transactions relative to eftpos (which tends to be priced separately), although the merchant-level data discussed below suggest this bias is small. As noted above, the margins charged by acquirers can also differ across networks, and appear to be higher for Mastercard and Visa on average (at least partly due to the impact of blended pricing). [5]
Merchant-level data on payment costs
To look at the distribution of payment costs across different merchants, the Bank collects anonymised merchant-level data on payment costs each year. These data show how much individual merchants pay, on average, to accept card payments under the eftpos, Mastercard and Visa networks. The 2020/21 data were collected from 11 large acquirers (and payment facilitators) and include card acceptance costs for more than 700,000 merchant accounts. [6] These merchant accounts processed a total of around $500 billion in transactions through the three card networks in 2020/21, making up around 80 per cent of the total value of transactions processed through these networks in Australia. The 2020/21 dataset for the first time also included information on each merchant’s industry and the type of payment pricing plan they were on.
The dataset captures merchants of all sizes. The vast majority (88 per cent) of merchant accounts are relatively small, processing less than $1 million per year in card transactions, with 48 per cent of merchants processing less than $100,000 in 2020/21 (Graph 4);[7] however, merchants that processed less than $1 million in card transactions accounted for only 22 per cent of total card transaction values. At the other end of the spectrum, while less than 1 per cent of merchants processed more than $10 million in card transactions, they accounted for 40 per cent of total transaction values.
Graph 4

Smaller merchants tend to pay higher average fees
The merchant-level data show that average payment costs tend to decrease as merchant size increases. To illustrate this, Graph 5 divides the sample of merchants into deciles, where each decile contains merchants that account for 10 per cent of the total value of card transactions in the 2020/21 dataset. The first decile includes around 525,000 merchants with an average of around $100,000 in card transactions in the year. By contrast, the 10th decile includes 34 merchants, processing on average $1.5 billion in card transactions in the year. As shown in the graph, the smallest merchants (in the first decile) had an average cost of acceptance across all three card types of 1.15 per cent of transaction values, while the largest merchants (in the 10th decile) had an average cost of acceptance of 0.47 per cent. Average payment costs for small merchants also tend to be more widely dispersed – for example, one-fifth of merchants with annual card turnover below $100,000 faced average payment costs of more than 2 per cent of transaction values.
Graph 5

There are several reasons why smaller businesses tend to face higher payment costs on average. There are some fixed costs associated with accepting card payments, such as purchasing or renting payment terminals, which for smaller merchants are spread over a lower volume of transactions, leading to higher average costs. Also, because of their higher transaction volumes, larger merchants are more likely to be able to negotiate favourable interchange and scheme fees set by card networks and may be able to negotiate lower acquirer margins.
Another factor that influences payment costs is the type of pricing plan a merchant is on. Pricing plans can be grouped into three main types:
- ‘Fixed’ (or ‘simple’) plans charge the same rate for all networks, cards and transaction types.[8]
- ‘Blended’ plans charge a few different rates, each of which may cover a number of networks, card and transaction types.
- ‘Unblended’ plans charge the merchant the wholesale cost of each transaction (interchange fees and scheme fees) plus an acquirer margin. This is also known as ‘interchange plus’ or ‘interchange plus plus’ pricing.[9]
The new data collected on merchants’ pricing plans show that smaller merchants are more likely to choose fixed plans – particularly merchants in the first decile that process less than $100,000 in card transactions each year on average (Graph 6). Some stakeholders have suggested that this may be because these plans are easier to understand and provide merchants with more certainty around their payment costs, since the cost of accepting a card payment is fixed regardless of the type of card used. However, these plans tend to be more expensive. [10] One reason for this is that, with fixed prices, the acquirer takes on the risk that there could be changes in the merchant’s transaction mix from one period to the next that result in higher wholesale costs for the acquirer (because the wholesale cost of individual transactions can vary significantly). Some acquirers offering fixed plans may also include more services than other acquirers, such as a single payment solution that covers both in-store and online purchases, better integration with accounting and inventory management software, or better analysis of merchants’ sales data. For some smaller merchants, the benefits of fixed plans in terms of simplicity, convenience and functionality could outweigh their higher cost.
Graph 6

A number of barriers to competition in the acquiring market are also likely to contribute to higher payment costs for smaller merchants. Payments concepts and pricing plans can be complicated, particularly for smaller merchants that may lack the time and other resources to study them, which can lead to a ‘set-and-forget’ approach to the selection of payment services. It can also be costly to switch to a new acquirer – for example, because of one-off transitional costs or because payment services may be part of a package that provides favourable prices on other banking services (such as credit facilities). A lack of price transparency can also be a barrier, with blended plans – which tend to be more competitively priced than fixed plans – usually negotiated individually between the acquirer and the merchant, based on the merchant’s specific card transaction mix (e.g. the share of credit versus debit card transactions that the merchant typically processes). These custom pricing plans, along with merchants often not having easy access to their detailed card transaction data, can make it difficult for merchants to compare different plans and shop around for a better deal.
In its recent Review, the Bank committed to take further steps to help improve competition in the acquiring market for smaller merchants. This includes regularly publishing summary information on average card payment costs for merchants of different sizes, as well as explanatory material about key concepts in card payments and acquiring services. The Bank is also continuing to support Treasury in exploring the possibility of extending the Consumer Data Right to acquiring services provided to small businesses, to make it easier for merchants to access their transaction data and seek quotes from alternative payment providers.
Merchants’ card payment costs not only vary by merchant size, but also by industry. For example, the data show that merchants in the airline industry faced the highest payment costs in 2020/21, on average, while merchants in the oil and gas industry faced the lowest. However, this mainly reflects a correlation between industry and other factors affecting payment costs, such as card transaction mix – for example, merchants in the airline industry tend to process a higher proportion of credit card (and possibly foreign-issued card) transactions, which cost more to accept on average than debit card transactions. Similarly, some industries are dominated by larger merchants, which tend to have lower card payment costs (and vice versa).
Average fees have declined over time as consumers have shifted to debit cards
In line with the aggregate data discussed above, merchants’ average cost of accepting card payments has typically declined since 2016/17 across merchants of different sizes, including for smaller merchants (Graph 7, top panel). This largely reflects a compositional shift in consumers’ card payments from credit cards to debit cards, which tend to be less expensive for merchants to accept.
Graph 7

However, as shown in the bottom panel of Graph 7, merchants’ average cost of accepting debit transactions has risen since 2016/17, mainly for those in the middle of the size distribution. This reflects the ongoing rise of contactless (including mobile) and online card payments in recent years, as most of these transactions are processed by Mastercard or Visa by default (which are typically more expensive). There has also been less competitive pressure on the interchange and scheme fees for mobile and online transactions. This is because LCR is currently not available for mobile wallet transactions, and because eftpos did not have the ability to process online transactions until recently.
Eftpos is currently the cheapest debit card network on average
The merchant-level dataset shows that average payment costs tend to be lower for larger merchants across each of the card networks. These data suggest that in 2020/21 eftpos was, on average, significantly cheaper to accept than the other debit card networks for merchants of all sizes. Acquirers charged around 23 basis points more on average for Mastercard and Visa debit cards than for eftpos transactions, with the difference ranging from 19–34 basis points across merchant-size deciles (Graph 8). This is similar to the average cost difference in the aggregate data shown in Graph 2 above.
Graph 8

However, these average price differences do not necessarily mean that eftpos is cheaper for any given merchant; in particular, for merchants with low average transaction sizes, eftpos may be more expensive in percentage terms, because acquirers often charge cents-based fees per transaction for eftpos (but percentage fees for other networks). Indeed, for around 10 per cent of merchants in this sample, accepting Mastercard and Visa debit cards was more than 10 basis points cheaper than eftpos. There was little difference between the costs of the debit networks for a further 30 per cent of merchants, many of whom were on ‘fixed’ pricing plans. For the remaining 60 per cent of merchants, eftpos was cheaper on average than the other debit networks. [11]
Least-cost routing: Limited take-up by merchants to date
With debit cards now the most frequently used payment method in Australia, the cost to merchants of accepting these cards has been an important area of focus for the Payments System Board.
Most domestically issued debit cards are dual-network debit cards. These cards allow transactions to be processed either through eftpos or one of the international debit networks (most commonly Visa or Mastercard). Prior to widespread use of contactless (‘tap-and-go’) technology, consumers would insert their dual-network debit card into the merchant’s payment terminal and then select the network to process the transaction. By contrast, for contactless payments the default is for the transaction to be automatically routed to the international debit network on the card. With those networks being generally more expensive for merchants, the increasing use of contactless functionality by consumers has resulted in higher costs to merchants for accepting debit transactions. As a result, for some years the Bank has been encouraging financial institutions to provide merchants with LCR functionality, which allows merchants to route dual-network debit card transactions via their preferred network – typically the one that costs them the least to accept.
LCR can help merchants to directly reduce their payment costs. It can also increase the competitive pressure between the debit networks, providing greater incentives for the networks to lower the wholesale fees that are ultimately paid by merchants. The Board has strongly supported the continued issuance of dual-network debit cards and the provision of LCR functionality because they contribute to efficiency and competition in the payments system. Following pressure from the Bank and other stakeholders, larger acquirers began offering LCR from 2018. However, low merchant take-up and limitations in the functionality provided by acquirers led the Bank to examine the availability and functioning of LCR in its Review, and to consider whether additional regulatory action was required (RBA 2019). The Board concluded that policy action to promote the provision and merchant awareness of LCR was indeed warranted, resulting in two main policy initiatives (RBA 2021):
- The Bank set an expectation, with immediate effect, that all acquirers and payment facilitators (which provide card acceptance services to merchants) would offer and promote LCR functionality to merchants in the device-present (in-person) environment. Acquirers and payment facilitators are also expected to report to the Bank on their LCR offerings, and on merchant take-up of LCR, every six months. This reporting requirement, and the latest results, are discussed further below.
- The Bank set an expectation that all acquirers, payment facilitators and gateways would offer and promote LCR functionality to merchants in the device-not-present (online) environment by the end of 2022; this deadline reflects the fact that LCR in the online environment is only becoming possible this year as eftpos completes the rollout of its online functionality. Acquirers, payment facilitators and gateways are also expected to report to the Bank on their LCR capabilities and offerings, and on merchant take-up of LCR, every six months.[12]
An important limitation to the expectation regarding LCR in the device-present environment was that it applied only to contactless transactions that are initiated by tapping a physical card – it did not extend to transactions initiated using a mobile wallet on a smart phone or other payment-enabled mobile device. While the benefits of enabling LCR for mobile-wallet transactions could be substantial, the Board concluded in the Review that these would likely be outweighed by the significant implementation costs, particularly given very limited international precedent for the functionality, as well as other legal and practical challenges. However, the accumulation of additional evidence, particularly through recent liaison with stakeholders, suggests that the technical implementation of LCR for mobile-wallet transactions would be less complex and costly than first thought. Accordingly, with the ongoing rapid growth in mobile-wallet transactions, the policy case for extending LCR to such transactions has strengthened. In view of these developments, the Board announced in August that it now expects the industry to make LCR functionality available for mobile-wallet transactions (RBA 2022).
The Bank has recently received the first round of six-monthly reporting from acquirers and payment facilitators on LCR for in-person transactions.[13] This includes qualitative information on providers’ LCR offerings and promotion activities, as well as data on the availability and take-up of LCR. Overall, the results show that the industry has not yet met the Bank’s expectations.
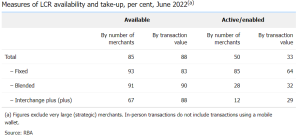
The results confirm that, as of mid-2022, LCR for in-person transactions is available to most merchants. By number, LCR is available to 85 per cent of merchants, with these merchants accounting for 88 per cent of the total value of debit transactions (Table 1). This shows that the industry as a whole has made good progress on making LCR technically available to merchants, and most acquirers and payment facilitators are meeting the Bank’s expectation (at least in regards to offering LCR for in-person transactions). However, these data show that there are some large gaps in availability at a small number of acquirers, most commonly because some older payment terminals do not have the requisite capability (Graph 9). The Bank has asked for concrete plans and assurances from the relevant acquirers that they will address these gaps promptly, to ensure that LCR is made available for in-person transactions for all their merchants.
Table 1: LCR for In-person Transactions
Graph 9

Having LCR technically available to merchants, however, does not necessarily mean that it is accessible in practice. Merchant groups have consistently highlighted that LCR is not easily accessible for merchants, arguing that acquirers and payment facilitators provide insufficient information and assistance. A key indicator of whether LCR is easily accessible, and whether the Bank’s expectations are having the desired effect, is the extent to which LCR is being taken up by merchants. The data show that take-up of LCR remains relatively low. By mid-2022, LCR had been enabled for only 50 per cent of merchants, with these merchants accounting for just 33 per cent of the total value of transactions. Take-up is especially low for merchants on interchange plus (plus) plans, which is particularly disappointing given that the benefits of LCR are so clear for merchants on these plans (since wholesale costs are passed straight through to merchants, with a fixed acquirer margin).[14]
In recent years some acquirers have rolled out ‘fixed’ (or ‘simple’) merchant payment plans with LCR implemented ‘in the background’ – that is, where the acquirer routes transactions to reduce their wholesale costs without the involvement of the merchant. The increasing availability of these plans appears to have made a material contribution to the overall take-up of LCR, particularly in terms of the number of merchants, with 85 per cent of merchants on fixed plans having LCR enabled. However, some stakeholders argue that fixed plans with LCR ‘in the background’ should not be considered as having implemented LCR, partly because the savings from LCR may not be fully passed on to merchants. If merchants on such plans were instead counted as not having LCR, then 40 per cent of merchants would have LCR available (accounting for 81 per cent of the total value of debit transactions) and overall take-up would be 9 per cent of merchants (28 per cent of the total value of debit transactions).
In addition, the LCR functionality provided by some acquirers and payment facilitators is quite rudimentary. Many providers continue to adopt a simple ‘all or nothing’ (or ‘binary’) approach for their merchants, whereby all routable transactions are sent to either eftpos or the default debit network, depending on which network is cheaper on average. Most providers also offer a more sophisticated approach to LCR, where the choice of network for an individual transaction depends on whether the transaction value is above or below a certain threshold. However, very few offer ‘dynamic’ LCR, which maximises savings by routing each individual transaction to the cheapest network for that particular transaction. A question for the industry and policymakers to consider is how much additional savings merchants could achieve by using ‘dynamic’ routing logic and how costly that would be to implement and roll out across all payment terminals.
Acquirers and payment facilitators generally make some information on LCR available to their merchant clients, including explanations of what LCR is, how merchants can benefit from LCR and how LCR can be enabled. This information is typically provided on their public websites. However, this information can be highly generalised, sometimes with little further detail that a merchant could use to determine how much they could save. In part, this reflects the fact that many key details will depend on the merchant’s unique circumstances. Most acquirers and payment facilitators have also taken at least some action to actively alert merchants to the potential benefits of LCR. However, merchant groups continue to report that merchants face a range of roadblocks when seeking further information on LCR and/or its implementation. Overall, particularly in light of the low take-up of LCR, many acquirers’ and payment facilitators’ promotion activities do not yet seem to meet the needs of merchants.
Conclusions
The average cost of accepting a card payment has continued to fall over recent years, extending the longer run downward trend due to reforms introduced by the Reserve Bank’s Payments System Board. However, the cost of accepting debit card payments has risen for smaller merchants, driven by the ongoing rise of contactless (including mobile) transactions. These transactions are typically routed to Mastercard and Visa, which tend to be more costly for most merchants than those processed by eftpos. More generally, smaller businesses typically face higher average payment costs than larger businesses.
The Bank continues to actively support LCR as a way of reducing merchants’ cost of accepting card payments, including by facilitating stronger competition between the card networks. The Bank has set expectations for the payments industry regarding LCR, including recently announcing that it expects LCR functionality to be made available for mobile-wallet transactions. Currently, LCR is widely available for in-person transactions, and this has put downward pressure on wholesale fees for debit transactions. However, new data reported to the Bank highlight that some notable gaps in LCR availability persist, and that merchant take-up of LCR remains low. This indicates that payment providers have more work to do to provide and promote this functionality to their merchant clients. The Bank is taking further action to support LCR under its mandate to promote a more efficient, competitive and safe payments system.
Authors: Troy Gill, Cara Holland and Georgia Wiley, Payments Policy Department, Reserve Bank of Australia
***
This article was first published by the Reserve Bank of Australia in the September 2022 Bulletin and has been republished with permission from the Bank.
If you enjoyed reading this article and would like to be notified when future articles are posted, please sign up for our email newsletter.
Are you interested in reading articles on a particular payments topic, company, payments industry executive or author? Click the search icon, it’s that magnifying glass on the top right-hand side of the website, and type in the keywords that interest you. You will then be presented with a list of any articles that match your search criteria.
Endnotes
[1] The payment service provider that provides services to a merchant to allow it to accept card payments, usually a bank, is known as the ‘acquirer’. In the case of payments using an American Express and Diners Club card, merchant fees are typically paid directly to the card network.
[2] This article is an update to Occhiutto (2020), which examined trends in merchants’ card payment costs based on data to the end of 2019.
[3] These data are part of the RBA’s Retail Payments Statistics, which are available at <https://www.rba.gov.au/payments-and-infrastructure/resources/payments-data.html>. The merchant fees data include both per-transaction fees and any other fees (such as the cost of renting a terminal to accept cards and monthly or annual account fees) that acquirers charge merchants for accepting card payments.
[4] New standards implemented in July 2017 reduced the weighted-average interchange fee benchmark for debit (and prepaid) cards from 12 cents to 8 cents, and introduced caps on individual interchange fees. In February 2022, as part of the Bank’s Review, the debit interchange standard was amended to reduce the cap on individual debit (and prepaid) interchange fees that are set in cents terms from 15 cents to 10 cents.
[5] More generally, aggregate data cannot be relied on to assess the cost of accepting different networks for an individual merchant, which will depend on a range of factors, including their size, type of payment pricing plan, average transaction size, card mix, industry and choice of acquirer.
[6] Payment facilitators provide card acceptance services mainly to smaller merchants and act as an intermediary between the merchant and the acquirer. They typically provide a simplified ‘all in one’ payments solution for merchants – for example, by offering a single service for accepting both in-store and online card payments.
[7] Hereafter, merchant accounts are referred to as ‘merchants’ for simplicity. However, individual outlets within chains or franchises may be treated by some acquirers as separate merchant accounts and receive separate merchant statements, even if their payments contracts are arranged on a group level. This would tend to overstate the true number of merchants and understate the true size of merchants in the sample.
[8] Some fixed plans may charge merchants a different rate for in-store versus online transactions, or for transactions made with Australian-issued versus foreign-issued cards.
[9] ‘Interchange plus plus’ plans charge the merchant for interchange fees, ‘plus’ scheme fees ‘plus’ an acquirer margin, while ‘interchange plus’ plans charge the merchant for interchange fees ‘plus’ an acquirer margin (with scheme fees subsumed within the acquirer margin, rather than being separated out).
[10] On average, and controlling for some other factors, we estimate that fixed plans are around 40 per cent (and blended plans are around 30 per cent) more expensive than unblended plans.
[11] As noted above, comparing the average cost of acceptance across debit networks is complicated by compositional differences and acquirer pricing. With regard to acquirer pricing, the merchant-level data allow us to estimate the potential upward bias that blended plans may introduce into the measured difference between the cost of accepting eftpos and the other debit networks. Comparing the average difference between the debit networks for blended versus unblended plans suggests that the upward bias is relatively small, in the ballpark of 2 basis points.
[12] The Bank also announced that it expects the industry to follow a set of principles regarding the implementation of LCR in the online environment, to address the Board’s concern that online LCR could be hindered by some industry participants taking divergent, or restrictive, approaches to its implementation
[13] Together, these initiatives formed part of a broader package of reforms designed to support the viability of LCR (RBA 2021).
The LCR reporting for in-person transactions includes nine large acquirers and payment facilitators, which together processed around 90 per cent of debit card transactions in the first half of 2022.
[14] The benefits of LCR for very large (strategic) merchants on interchange plus (plus) plans is not always clear, given that enabling LCR will often result in them losing their discounted (strategic) interchange rates on debit transactions processed by the international card networks. The data reported in this section exclude ‘strategic’ merchants.
References
Occhiutto K (2020), ‘The Cost of Card Payments for Merchants’, RBA Bulletin, March.
RBA (Reserve Bank of Australia) (2019), ‘Review of Retail Payments Regulation: Issues Paper’, November.
RBA (2021), ‘Review of Retail Payments Regulation: Conclusions Paper’, October.
RBA (2022), ‘Payments System Board Update: August 2022 Meeting’, Media Release No 2022-27, 25 August.